The Most Important Social Media Metrics to Track in 2026
15 social media metrics that matter in 2026: engagement, reach, conversions, ROI, and how to calculate each one.

TL;DR
Social media metrics in 2026 fall into six categories: engagement, awareness, conversions, ROI, customer care and content performance. If you only watch four numbers, make them engagement rate, click through rate, conversion rate and ROI, since those four map most directly to whether your social effort is actually working.
Quick version: engagement rate tells you if your content is good, click-through rate tells you if it drives traffic, conversion rate tells you if that traffic turns into something real, and ROI tells you if the whole effort is profitable. Saves and shares matter more than likes for algorithm ranking. Below, you will find every formula, benchmark, and platform breakdown you need, along with a comparison table at the end.
Introduction
It is easy to open an analytics dashboard, see a wall of numbers, and feel like you are being productive just by looking at it. Impressions went up, that is good, right? Maybe. Maybe not. A lot of the numbers platforms show you first look impressive but don’t actually tell you whether your business is better off this month than last month.
This guide sorts through that noise. It groups every metric worth tracking into six categories, gives you the exact formula for each one along with realistic benchmarks, and breaks down which numbers matter most on each individual platform. By the end, you should be able to build a simple dashboard that shows you four or five real signals instead of forty numbers that mostly just look busy.

Most Important Social Media Metrics to Track in 2026
Social media metrics split cleanly into six categories, and understanding the split makes it much easier to decide what to actually track.
Engagement Metrics
Engagement metrics measure how people interact with your content once they see it, covering likes, comments, saves and shares. This is the clearest signal of whether your content is actually good, as opposed to just seen.
Awareness Metrics
Awareness metrics measure how far your content spreads, covering reach, impressions and follower growth. These tell you about exposure, not necessarily quality.
Conversion Metrics
Conversion metrics measure how social activity turns into business results, covering click through rate, conversion rate and leads generated. This is where social starts connecting to revenue.
ROI Metrics
ROI metrics measure how social contributes to the bottom line specifically, covering return on investment and customer acquisition cost. This is the category that answers whether the whole effort is worth the money and time going into it.
Customer Care Metrics
Customer care metrics measure how well you serve your audience through social channels, covering response time, resolution rate and sentiment. These matter more than people expect, since a slow or dismissive reply in public can undo weeks of good content.
Content Performance Metrics
Content performance metrics measure what actually works, covering top posts, format performance and posting time. This category is less about a single number and more about spotting patterns across everything you have already published.
The rule that ties all of this together: track what aligns with your actual goals. Trying to track everything usually means paying close attention to nothing, since your focus gets spread too thin to notice what actually changed.
Reach vs Impressions: What Is the Difference?
These two get mixed up constantly, and the difference actually matters for how you read your numbers.
Reach counts the number of unique people who saw your content. If 1,000 different people saw your post, your reach is 1,000, full stop, no matter how many times any individual person saw it again.
Impressions count the total number of times your content was displayed, including repeat views. If those same 1,000 people each saw the post twice, your impressions would be 2,000, even though your reach stayed exactly the same.
The relationship between the two is fixed: impressions are always equal to or higher than reach, never lower. If your impressions are running far above your reach, it usually means the same audience is seeing your content repeatedly, which can be a good sign, since it suggests the algorithm is choosing to show it again, or a flat one, if it just means your following is small and static.
Reach tends to matter more for growth, since it tells you how many new eyes are actually landing on your content, while impressions are more useful for understanding how often your existing audience is being reminded you exist.
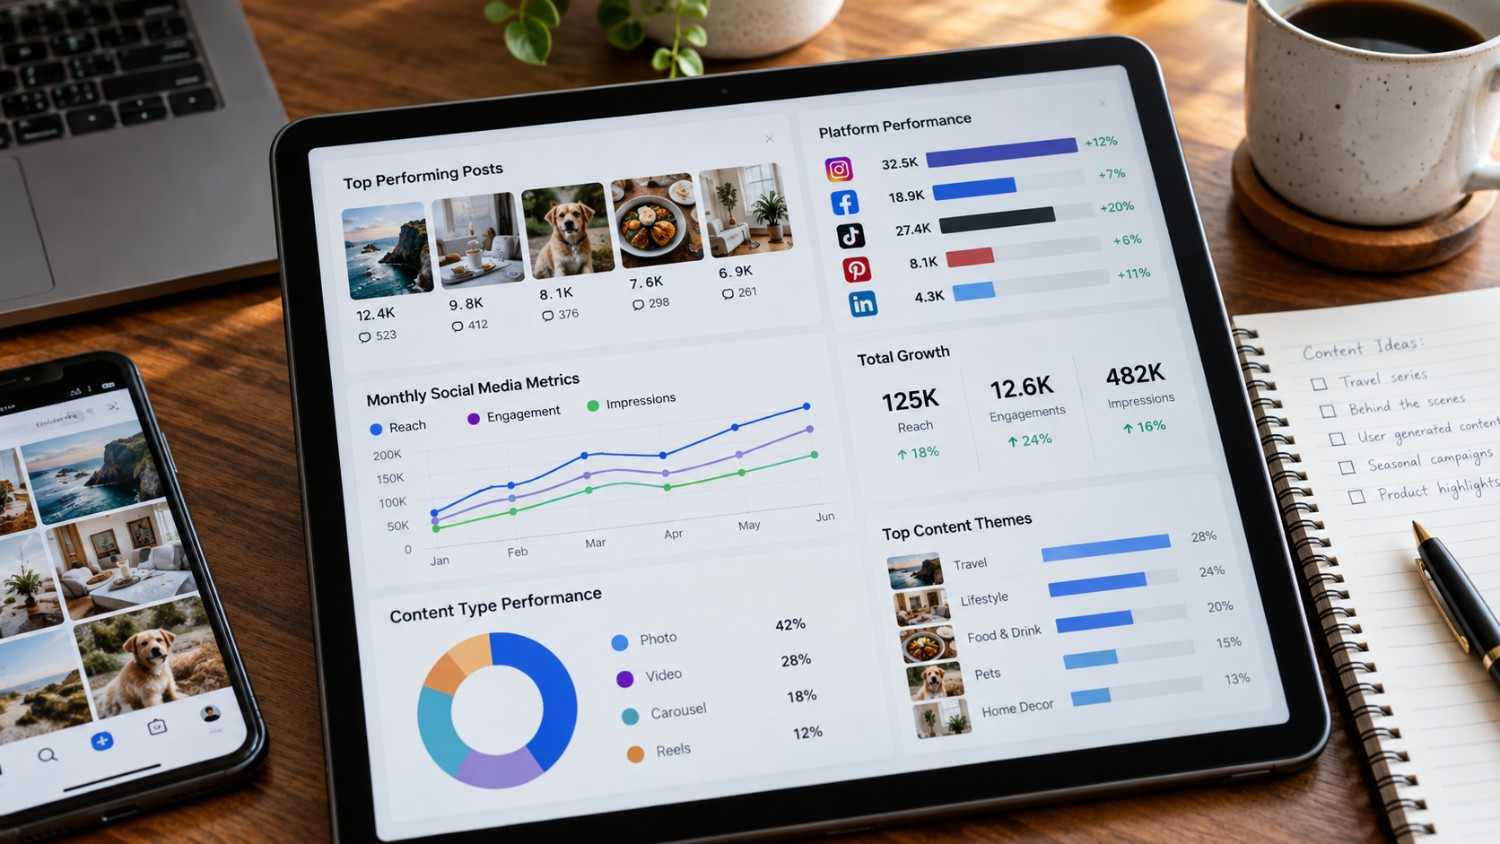
How to Calculate Social Media Engagement Rate
Engagement rate is probably the single most quoted metric in social media, and it is worth knowing exactly how to calculate it rather than trusting a platform’s built in number blindly.
Formula: (Total Engagements divided by Reach) multiplied by 100 equals Engagement Rate.
Example: 500 engagements divided by 10,000 reach gives you a 5 percent engagement rate.
There is also an alternative version worth knowing. (Total Engagements divided by Followers) multiplied by 100 gives you Engagement Rate by Followers instead.
The difference matters. Engagement rate by reach tells you how your content performs with the people who actually saw it, which is the more honest number if your content is reaching beyond your existing followers. Engagement rate by followers tells you how loyal and active your existing audience is, which matters more if your growth strategy leans on repeat engagement from the same core group.
As a rough benchmark, 1 to 3 percent is average, 3 to 5 percent is good, and anything above 5 percent is excellent. These numbers shift by platform and niche, so treat them as a general reference rather than a strict pass or fail line.
https://youtu.be/0RAvd-ng8Ew?si=gS37Y4EaZ7vucjvy
Which Engagement Metrics Actually Matter
Not every form of engagement carries the same weight, and knowing the hierarchy changes what you should actually optimize for.
At the top sit saves, shares and comments. Saves mean someone found the content valuable enough to want to come back to it later, and platforms tend to treat this as one of the strongest signals in their ranking algorithms. Shares mean someone was willing to put your content in front of their own audience, which gives it the highest reach potential of any engagement type. Comments mean someone cared enough to start or join a conversation, which signals real, meaningful engagement rather than a passive tap.
In the middle sit profile visits and link clicks. A profile visit means someone wanted to learn more about who made the content, and a link click means they were curious enough to leave the platform entirely, which is a genuinely high bar to clear.
At the bottom sits the like. It is easy, low effort, and still worth something as a rough popularity signal, but it carries far less weight than the categories above it.
The practical takeaway is that saves and shares deserve more of your attention in 2026 than raw like counts do, since they are the metrics most closely tied to how algorithms decide what to show more people.

How to Track Follower Growth Rate
Total follower count gets a lot of attention, but growth rate tells you far more about the health of an account than the raw number ever will.
Formula: (New Followers divided by Starting Followers) multiplied by 100 equals Follower Growth Rate.
Example: 500 new followers divided by a starting count of 10,000 gives you a 5 percent growth rate.
Calculate this monthly or quarterly rather than weekly, since week to week numbers bounce around too much to mean anything on their own. A single viral post can distort a weekly number badly, while a monthly view smooths that out.
As a benchmark, 1 to 2 percent monthly growth is healthy for an established account, 3 to 5 percent is excellent, and anything above 5 percent usually points to something going genuinely viral.
The point worth remembering here is that growth rate matters more than the total follower count by itself. A 5 percent growth rate on an account with 1,000 followers is a better sign of momentum than a 0.1 percent growth rate on an account sitting at 100,000, even though the second account looks more impressive at a glance.
How to Measure Click Through Rate From Social Media
Click through rate tells you whether your content is actually compelling enough to make someone leave the platform and go somewhere else.
Formula: (Total Clicks divided by Total Impressions) multiplied by 100 equals Click Through Rate.
Example: 500 clicks divided by 10,000 impressions gives you a 5 percent click through rate.
As a benchmark, 1 to 2 percent is average, 2 to 5 percent is good, and anything above 5 percent is excellent, though this varies noticeably by platform and by how much friction there is in your call to action.
A high CTR shows your content is engaging in its own right, not just visible. It measures the gap between people seeing something and people caring enough to act on it, which is a meaningfully different question than reach or impressions answer.
How to Track Social Media Conversions and Leads
Conversions are where social media activity finally connects to something concrete for the business.
Formula: (Total Conversions divided by Total Clicks) multiplied by 100 equals Conversion Rate.
Example: 50 conversions out of 500 clicks gives you a 10 percent conversion rate.
What actually counts as a conversion depends on your goals, but common examples include a purchase, a sign up, a download, a form submission or a qualified lead generated through a social channel.
Conversion rate is arguably the single most important metric for proving business impact, since it moves past vanity numbers entirely and shows whether the traffic your content generates actually does something once it arrives.

How to Measure Social Media ROI
Return on investment is the number that ties everything else together, and it is usually the one that gets a budget approved or cut.
Formula: ((Revenue from Social minus Cost of Social) divided by Cost of Social) multiplied by 100 equals ROI.
Example: $10,000 in revenue minus $2,000 in cost, divided by that same $2,000 cost, gives you a 400 percent ROI.
When calculating cost, be thorough. Include ad spend, tool subscriptions, team time and content creation costs, since leaving any of those out inflates your ROI artificially and makes decisions based on a number that is not actually accurate.
ROI is the metric executives tend to care about most, because it answers the one question every other metric is really building toward: is this effort actually worth what it costs.
Video Metrics: Watch Time, Completion Rate and Retention
Video has become such a large part of social content that it earns its own dedicated metrics.
Watch time measures how long people actually spend watching your video, and it is treated as the single most important video metric by most platform algorithms, since it directly signals how engaging the content is.
Completion rate measures what percentage of viewers watch all the way to the end. Higher completion rates tell you the content held attention from start to finish rather than losing people partway through.
Retention rate shows how many viewers keep watching at each point along the video, which is genuinely useful for spotting exactly where people drop off, sometimes revealing that a specific transition or a slow intro is quietly costing you a big chunk of your audience.
As benchmarks, 50 percent or higher completion rate is considered good, 70 percent or higher is excellent, and anything above 90 percent usually points to a video that is on its way to going properly viral.

How to Track Saves, Shares and Comments
These three metrics were flagged earlier as the highest value engagement signals, so it is worth being specific about how to actually track them.
Saves show up in each platform’s native analytics, and a rising save count on a specific post is a strong signal that the content has real reference value, the kind people want to come back to later.
Shares are also visible in platform analytics, and tracking which posts get shared most tells you what content your audience feels comfortable putting in front of their own network.
Comments are worth tracking for both quantity and quality. A post with fifty short comments is not necessarily more valuable than one with ten thoughtful, detailed ones, so read the actual comments occasionally rather than just counting them.
The practical move is to track these three per post, not just as an account wide average, so you can identify exactly which type of content consistently earns saves, shares and comments and do more of it.
https://youtu.be/1ja9ayFjlrA?si=4coxetLrtb_zGLk3
Best Social Media Metrics for Brand Awareness
Awareness metrics answer a different question than engagement metrics do, they tell you how many people know your brand exists at all, regardless of whether they have interacted with it yet.
Reach measures how many unique people have seen your content. Impressions measure how many times people have seen your content in total. Brand mentions track how often people talk about your brand, tagged or not. Share of voice measures what percentage of the total conversation in your industry mentions your brand specifically, compared to competitors.
As a benchmark, category leaders in a given industry typically command somewhere between 25 and 40 percent share of voice, though this varies enormously depending on how fragmented or consolidated a particular niche is.
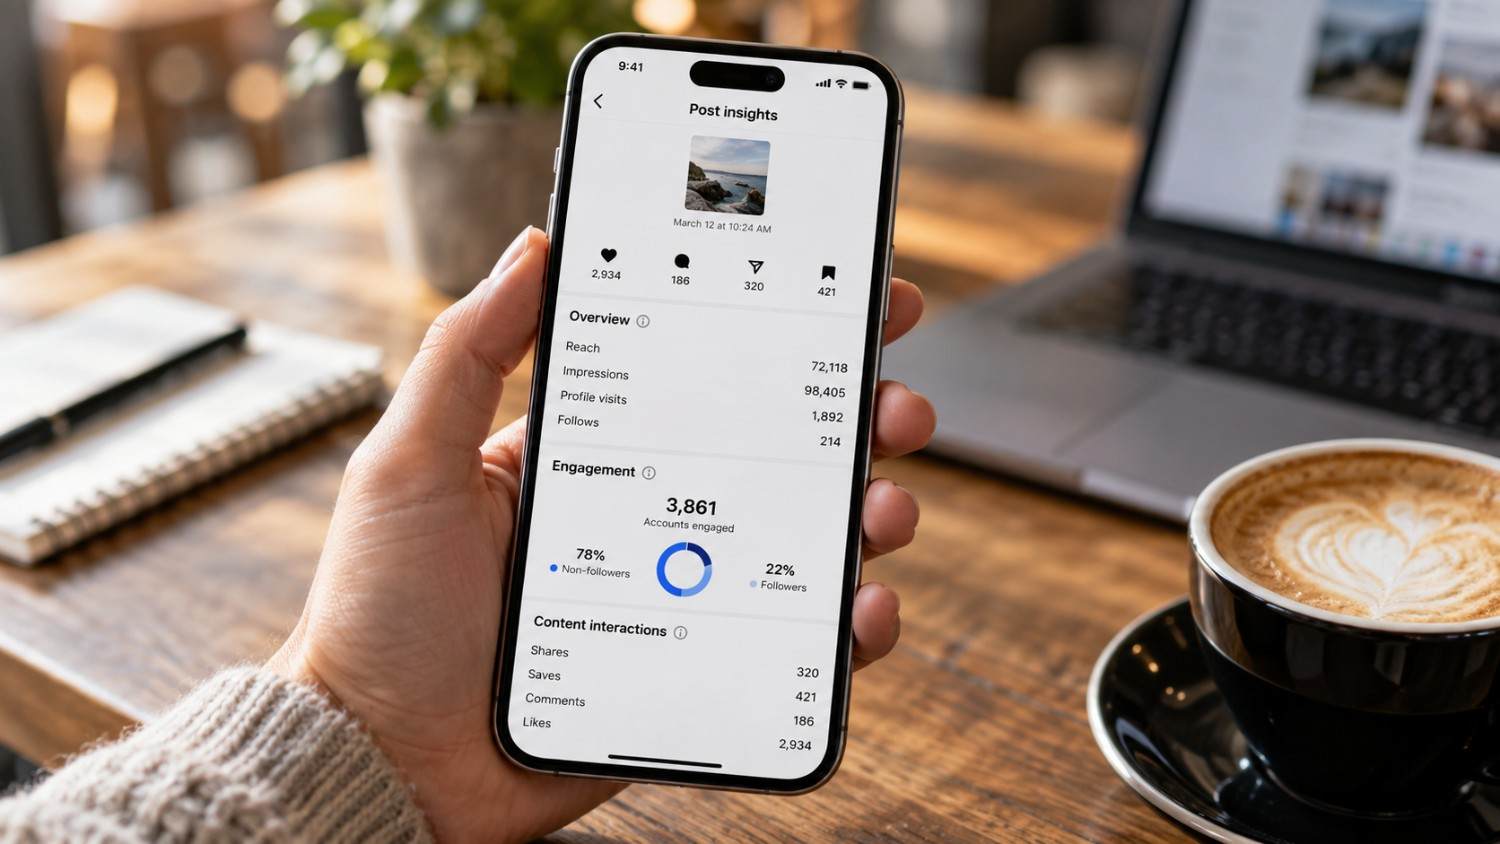
Best Metrics for Instagram, TikTok, LinkedIn, Facebook and X
Every platform rewards slightly different behavior, so the metrics worth prioritizing shift depending on where you are posting.
On Instagram, focus on engagement rate driven by saves and shares, Reels reach and watch time, Story views and replies, and profile visits alongside link clicks.
On TikTok, watch time and completion rate matter most, alongside shares, saves, comments and duets, plus profile visits and new follows.
On LinkedIn, engagement rate driven by comments and shares matters, along with click through rate, follower growth rate and article views and reads.
On Facebook, reach and impressions still carry real weight, along with engagement rate, click-through rate, and activity in any groups you run.
On X, impressions and reach are important, as are engagement rates measured through retweets and replies, click-through rates, and profile visits.
The takeaway across all five platforms is that no single metric transfers cleanly from one to another. A great engagement rate on LinkedIn and a great one on TikTok are built from entirely different kinds of interaction, so compare a platform against its own history rather than against a different platform’s numbers.
How to Build a Social Media Analytics Dashboard
A dashboard exists to pull scattered numbers into one place you can actually glance at weekly rather than digging through five separate apps.
Step 1: Define your goals first. Decide which of the six categories above actually matters most for where your business is right now, since that decides which metrics deserve a spot on the dashboard.
Step 2: Choose your tools. Platform native analytics, Google Analytics for anything tied to your website, or a dedicated social analytics tool, all work, and most setups end up combining more than one.
Step 3: Set up tracking properly. Connect your accounts, and set up UTM parameters on any link you post so clicks and conversions can actually be traced back to the specific post that drove them.
Step 4: Build the dashboard itself, keeping it to key metrics, trends over time, and comparisons between posts or campaigns rather than a giant unfiltered data dump.
Step 5: Review it weekly. A dashboard nobody looks at is worthless, so build the habit of checking it on a set day and adjusting strategy based on what it actually shows.
Centralizing These Metrics in One Dashboard
Pulling reach, impressions, engagement and click data from five separate native apps every week gets old fast, and it is easy to lose an hour just copying numbers into a spreadsheet before you have even started analyzing anything.
Social by InstantDM covers this specific piece. It is a scheduling and analytics tool, and its analytics module tracks impressions, engagement, clicks, and follower growth across every channel you connect, with per- post metrics you can compare directly against each other rather than hunting through separate apps. Agencies and teams managing more than one brand can also generate white label reports from the same data. It does not calculate ROI, conversion rate, or customer acquisition cost on its own, since those depend on your specific costs and business goals, so you would still need to bring those numbers in from your own records. However, for the reach, engagement, and click side of the dashboard, it removes a lot of the manual pulling and pasting. You can see how it works at https://socialbyidm.com.
Which Social Media Metrics Are Vanity Metrics?
Vanity metrics look impressive in a screenshot but rarely tell you anything about whether the business is actually better off.
Follower count is the most obvious example. A large following does not guarantee engagement, and it certainly does not guarantee revenue, since inactive or disinterested followers pad the number without adding any real value.
Likes fall into the same trap. They are the lowest effort form of engagement available, and while they are not meaningless, they do not indicate the kind of meaningful interaction that saves, shares and comments do.
Impressions can mislead too. Total exposure is not the same as unique reach or genuine engagement, and a high impression count can hide the fact that the same small group of people is simply seeing your content over and over.
The fix is straightforward: build your dashboard around actionable metrics instead. Engagement rate, click through rate and conversion rate all tell you something you can actually act on, which is more than a vanity metric will ever give you no matter how good it looks in a report.
Social Media Metrics Comparison
| Metric | What It Measures | Formula | Benchmark |
|---|---|---|---|
| Engagement Rate | Content quality | (Engagements / Reach) x 100 | 3 to 5% is good |
| Click Through Rate | Traffic driving | (Clicks / Impressions) x 100 | 2 to 5% is good |
| Conversion Rate | Business impact | (Conversions / Clicks) x 100 | 2 to 5% is good |
| Follower Growth Rate | Audience growth | (New Followers / Starting) x 100 | 1 to 2% monthly |
| ROI | Profitability | ((Revenue - Cost) / Cost) x 100 | 200%+ is good |
| Watch Time | Video quality | Total watch time in seconds | 50%+ completion |
| Share of Voice | Brand awareness | (Your Mentions / Total) x 100 | 25 to 40% |
The Bottom Line
Social media metrics in 2026 break down into six categories: engagement, awareness, conversions, ROI, customer care and content performance. Of all these metrics, engagement rate, click-through rate, conversion rate, and ROI are the most important for understanding whether your efforts are actually working.
Vanity metrics do not pay bills. A large follower count or a high impression number can feel good to look at, but they rarely tell you anything you can act on. Build your dashboard around the numbers that do.
Start by defining your goals, choose the handful of metrics that actually reflect them, set up proper tracking, and review the results on a set schedule every week. That habit, more than any single metric, is what actually improves your results over time.
Reference:
https://blog.hootsuite.com/social-media-metrics/
Frequently asked questions
What are the most important social media metrics in 2026?
Engagement rate, click through rate, conversion rate and ROI matter most. Together they measure content quality, traffic driven, business impact and overall profitability.
How do I calculate social media engagement rate?
Divide total engagements by reach, then multiply by 100. For example, 500 engagements divided by 10,000 reach gives you a 5 percent engagement rate.
What are vanity metrics on social media?
Follower count, likes and impressions are the classic vanity metrics. They look good in a report but do not reliably drive business results, so lean on engagement rate, click through rate and conversion rate instead.
How do I measure social media ROI?
Use ((Revenue from Social minus Cost of Social) divided by Cost of Social) multiplied by 100. Make sure your cost figure includes ad spend, tool subscriptions and team time, not just ad spend alone.
Which metrics matter most for each platform?
Instagram rewards saves and shares. TikTok rewards watch time and completion rate. LinkedIn rewards comments and click through rate. Facebook rewards reach and engagement rate. X rewards retweets and replies.